Justice
Visualise a history of CO2 emissions with these graphs:
1. Source of global emissions vs population
2. Historic percentage of all global CO2 emissions selected countries
Note that the UK started off as the major industrial power, so in the 1700s it was nearly 100% of all recorded emissions
3. Visualise cumulative CO2 emmissions by region
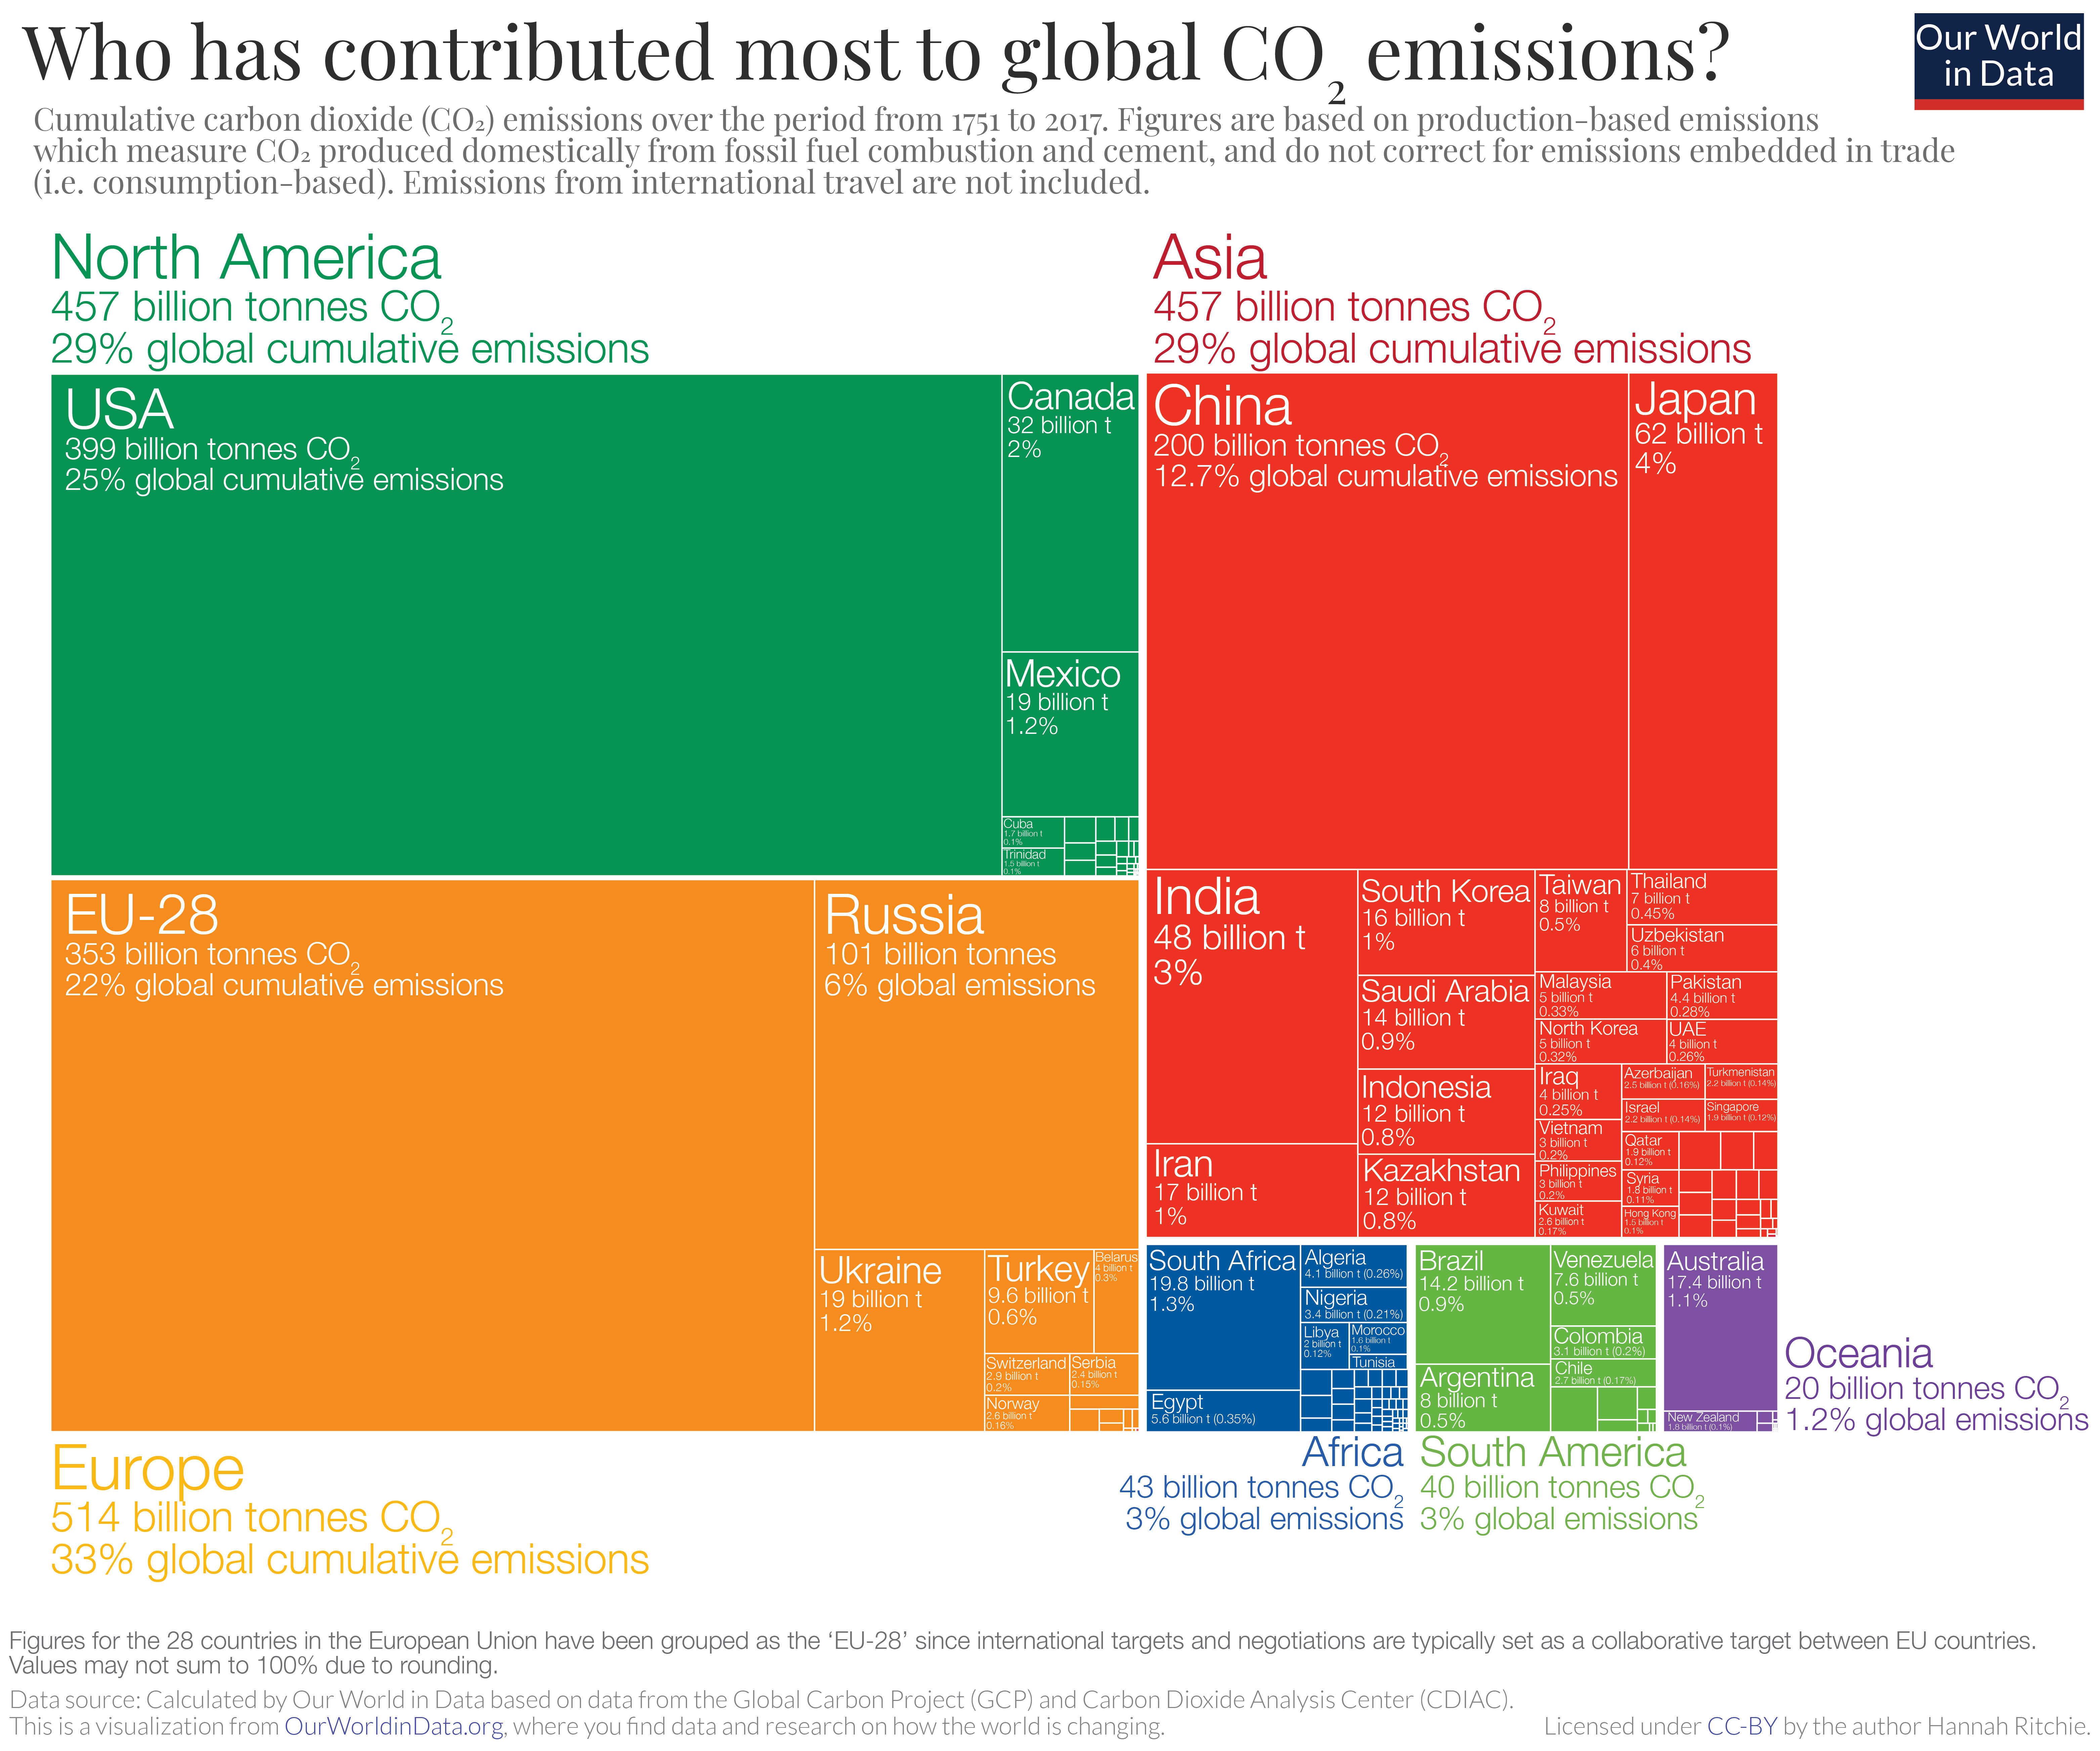
Click here to open the image and zoom in
Note: These charts show pollution from burning fossil fuels. They don't include emissions from cutting down trees or changing the way land is used which are estimated to be about 30-35% of all emissions. A lot of land use changes were driven by colonisation.
![]()